More Telegraf
Finilizing my Telegraf configs
Ivan Elfimov, 2023-06-26, 1m (181)
It turned out, that Telegraf can push metrics in Prometheus format directly into my VictoriaMetrics server. And that made it possible to get rid of VMAgent entirely.
I was a bit confused that Telegraf showed all metrics slightly less than the Node Exporter.
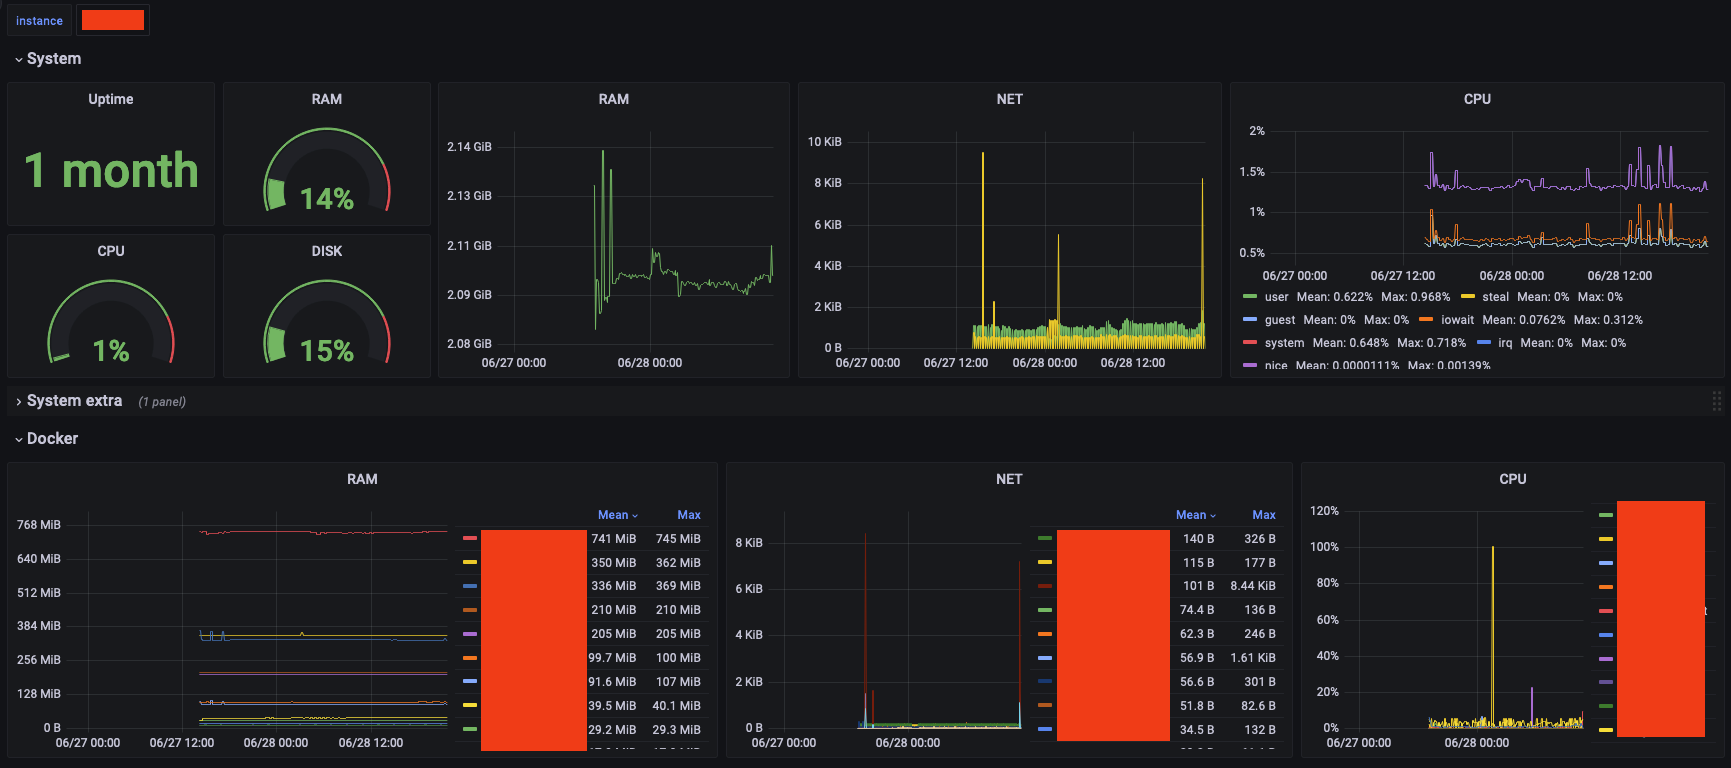
This how it looks like at the moment:
You probably noticed, that these metrics are not what I talked about earlier. Yes, these are from another server, just to show how universal this dashboard is.
- I can change
instanceto see how my different servers are doing - there are basic system metrics
- and some basic Docker container metrics
I find per_device metrics a bit excessive. But I decided to collect them for a while and decide if I want to keep collecting them later on.
Realistically, all I need to know is RAM and Disk usage. You should also pay close attention to these on your machines. As they say, there is no such thing as too much RAM.
The next good step would be to set up a couple of alerts. But that is for another time.
- S3 Access Policies and MinIO client 2023-06-28
- Back to Telegraf 2023-06-25
- Проект server 2020-02-24